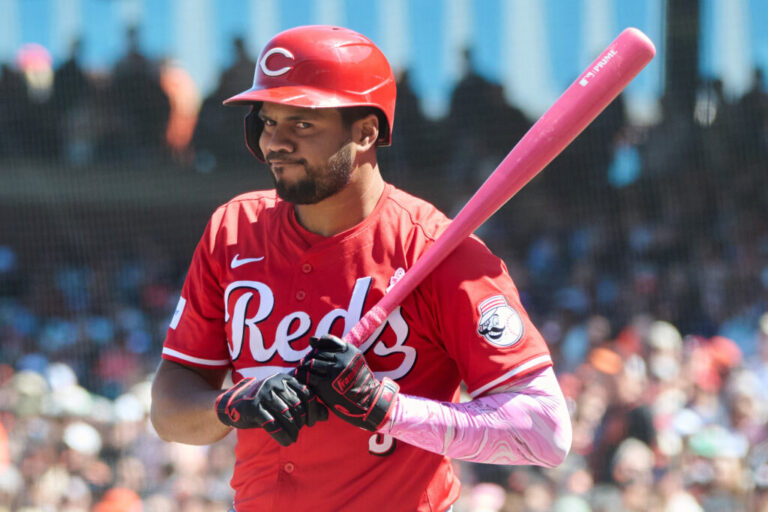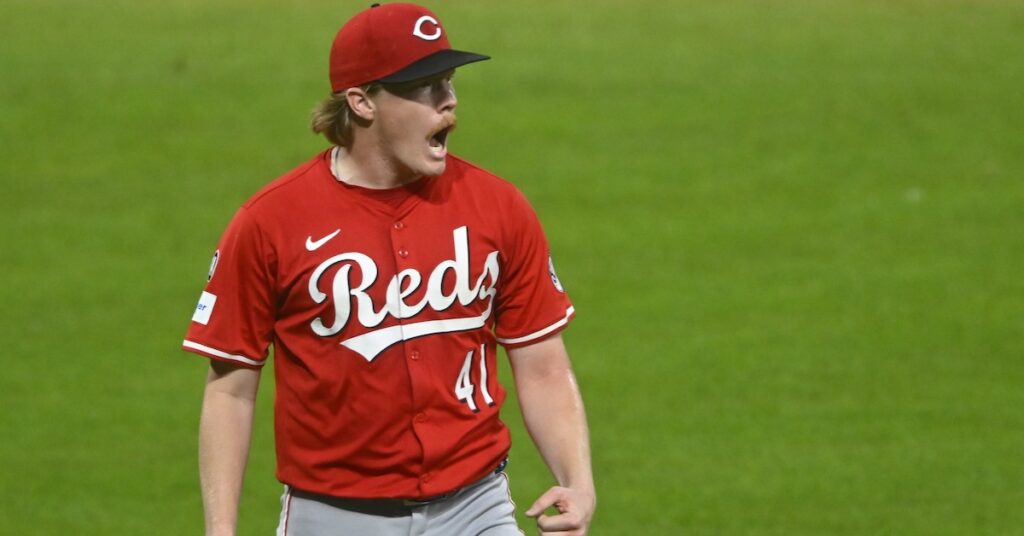
I thought the other shoe was dropping on Andrew Abbott when the Brewers knocked him around last week. If your worst start of the season is five runs on seven hits in six innings, that means you’re having a damn good season, but I didn’t expect Abbott to keep rocking an ERA in the 1.50s all year. Surely some regression was coming.
A week later, it seems the other shoe remains aloft. Abbott followed up that rough day at the office with a shutout of the Guardians on Tuesday, his first career complete game. It was his fourth scoreless start of five innings or more this season, and the ninth time (out of 11) that he’s surrendered one run or less.
How’s he doing it? Well, a few weeks ago Jake Mailhot called Abbott a “contact-suppression monster,” owing to his funky fastball movement and some offseason tweaks to his changeup.
Take a moment and close your eyes. Imagine “weak contact.” It’s a foundational idiom for how we talk about pitchers, but in practice it’s a pretty big tent. What type of batted ball did you picture? Probably a soft groundball, maybe a chopper in front of the plate.
That’s not really Abbott’s thing. He’s one of the most fly ball-happy pitchers in baseball. Among pitchers with at least 50 innings this year, Abbott has the second-lowest GB/FB ratio, behind his teammate Hunter Greene. Brady Singer and Nick Martinez are also in the bottom 20, which is interesting. If my team played in a ballpark that sucks fly balls into the stands, as the Reds do, I might think twice about assembling a rotation like that. But hey, everything’s working great so far, so what do I know?
I wrote about this during Abbott’s rookie season, and it’s still true: He pitches upside-down. The orthodox weak contact method involves sinking the ball to get the hitter to beat it into the ground, while Abbott gets hitters to pop up.
Abbott’s success has caused me to ruminate on the popup, and I think we’re sleeping on it as a humiliation for hitters. Hit a weak grounder, and there’s action, the chance of a bad bounce or a bobble or an unexpected hole in the infield turning that offensive failure into a trip to first base. On some 17,000 grounders this year that were classified as poor contact, the league is hitting .177 with a .162 wOBA. Not great odds, but not zero either.
Pop the ball up and everyone in the park knows, in a fraction of a second, that you’re drawing dead. Then you have to spend the next five to eight seconds jogging in the general direction of first base like you’ve still got a chance of reaching. But you don’t. With four infielders in pursuit, plus the pitcher and catcher, someone is going to be able to settle under that popup unless there’s a catastrophic failure of defensive execution. To wit: The league is hitting .010 with a .009 wOBA on popups this year.
Consider this scene from the documentary Major League.
The sharpest part of Jake Taylor’s monologue has nothing to do with poor Mike Rexman being betrayed by his wife at the Capri Lounge. It’s, “Uh-oh, Rexie, I don’t think this one’s got the distance.” At least with a strikeout, it’s over quickly. Unless you fall over or lose your helmet or something, the spotlight of humiliation goes out right away. Not so when custom demands that the batter run out the popup until it’s caught.
Our batted ball leaderboards have a column for IFFB%; the league leader (minimum 50 IP) is Michael Wacha at 19.4%. This stat is a little wonky, because the denominator is not all batted balls, but fly balls only. If Wacha could really turn 19.4% of his batted balls into popups with an xBA of .010, he’d be the best pitcher in the league. The real number is closer to 8%.
Leaders in Popups per Ball in Play
Hey, look, there’s Abbott. Good morrow.
Even getting popups on 6% of batted balls is something. With that said, the practical difference between an infield popup and a short fly ball is pretty minimal. Just ask Pete Kozma. So I wanted to see who leads the league in percentage of batted balls that are hit 1) in the air 2) with an xwOBA of .020 or less, based on exit velo and launch angle. Here are the 10 best pitchers, with a minimum of 100 balls in play.
Leaders in Popups (Ish) per Ball in Play, Part II
SOURCE: Baseball Savant
What’s all that worth to a pitcher? Well, here’s a fun little bit of symmetry: The league-wide wOBA on infield fly balls is .009, as I’ve said, which is functionally equivalent to the league-wide wOBA on strikeouts, which is obviously .000.
The league-wide wOBA on line drives this year is .694; the league-wide wOBA on walks and hit batters is .698. Treating popups as equivalent to strikeouts and line drives as equivalent to free passes is fuzzy math, but not that fuzzy.
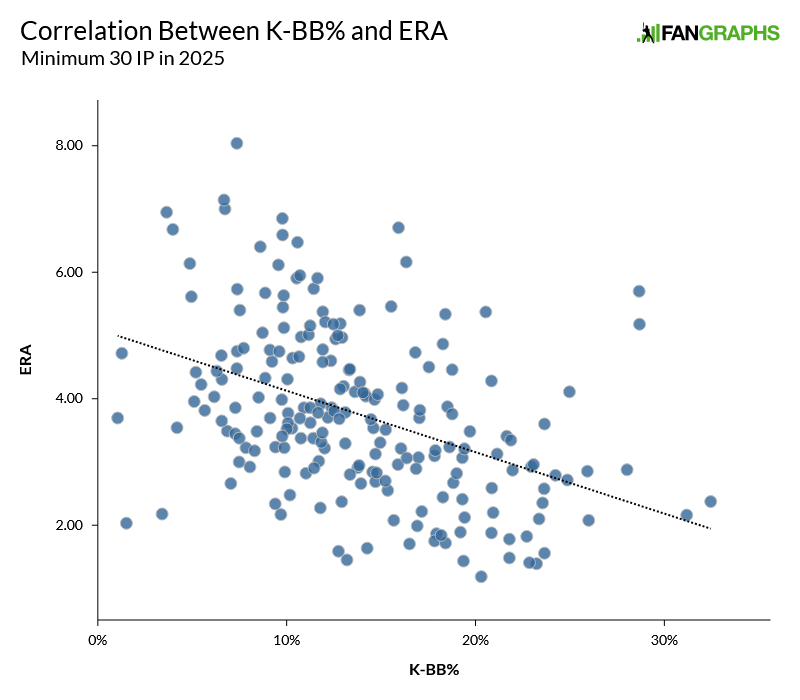
We use K-BB% as a shorthand to judge how well pitchers control two of the three true outcomes. Out of 207 pitches with at least 30 innings this year, the three best K-BB% marks belong to Logan Gilbert, Tarik Skubal, and Cole Ragans. The three worst belong to Randy Vásquez, Roki Sasaki, and Daniel Lynch IV. (Lynch has a 2.03 ERA but a 4.65 FIP, which is an incongruity so extreme Mao Zedong would be, like, “Whoa, that’s too much contradiction for me.”)
But since a popup is as good as a strikeout, and a line drive is as good as a walk (or a hit batter), we could do the same for what I’ll call, with apologies to Stephen Colbert, the Five Truthy Outcomes. Why am I calling them that? Because “(K+IFFB)-(LD+BB+HBP)%” feels untenably unwieldy.
League Leaders in (K+IFFB)-(LD+BB+HBP)%
| Name | Team | (K+IFFB)-(LD+BB+HBP)% | K-BB% | ERA | FIP |
|---|---|---|---|---|---|
| Logan Gilbert | SEA | 21.37% | 32.48% | 2.37 | 2.15 |
| Jeremiah Estrada | SDP | 21.14% | 26.02% | 2.08 | 2.68 |
| Tarik Skubal | DET | 20.70% | 31.21% | 2.16 | 1.85 |
| Jeff Hoffman | TOR | 19.67% | 28.69% | 5.70 | 4.47 |
| Cole Ragans | KCR | 18.18% | 28.71% | 5.18 | 2.40 |
| MacKenzie Gore | WSN | 17.38% | 28.05% | 2.88 | 2.63 |
| Joe Ryan | MIN | 17.24% | 23.10% | 2.96 | 3.42 |
| Hunter Greene | CIN | 16.88% | 24.89% | 2.72 | 3.39 |
| Garrett Crochet | BOS | 16.19% | 23.58% | 2.35 | 2.68 |
| Michael King | SDP | 16.00% | 20.89% | 2.59 | 3.20 |
This changes things less than I was anticipating. The top-six pitchers in K-BB% are still the top six once you add hit batters and the two contact types into the mix, just in a different order. The biggest positive mover is King, who jumps from 28th to 10th. Zack Wheeler drops from seventh to 17th.
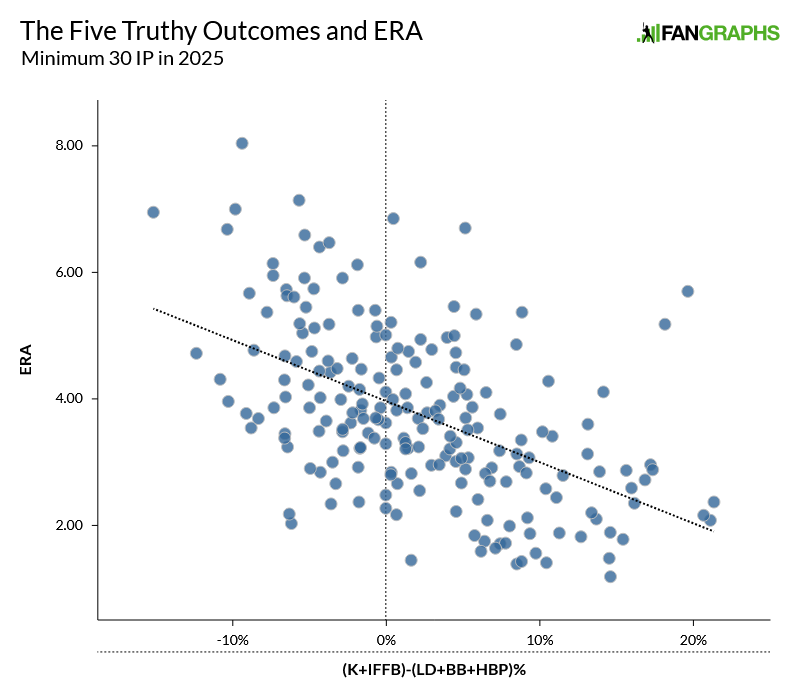
Even so, the more complicated model is a better way to judge performance. Or, at least, it’s better at predicting ERA. Both K-BB% and the truthy outcomes formula are negatively correlated with ERA; the further above break-even the pitcher is, the lower his ERA gets. The correlation coefficient (which shows the strength of that correlation on a scale from -1 to 1, with stronger correlations being further from zero) between K-BB% and ERA is -.427. For (K+IFFB)-(LD+BB+HBP)%, it’s -.521.
So does the master popup author, Abbott, benefit from taking these extra variables into account? You bet. Abbott’s K-BB% is 17.96%, which is 51st out of the 207 pitchers listed. Taking into account hit batters, infield fly balls, and line drives, Abbott is at 9.39%, which is 32nd.
This new stat flatters other pitchers more than Abbott, but not many. I was going to tack on a table of the pitchers with the smallest difference between K-BB% and the batted ball-added category, but I ended up with “[(K+IFFB)-(LD+BB+HBP)%]-(K-BB%)” in a column header and decided I didn’t want to bother. Will Vest leads the league here, Abbott is 32nd again, and Jakob Junis is at the bottom.
All of which is quite interesting, but it’s hard to quantify the core essence of the popup: as one of the greatest humiliations a pitcher can visit upon his opponent.