1. BEST: Business successes
Baseball, as we all know, is a business.
Each club has two interrelated goals — winning games and attracting fans. Success on the first count normally leads to positive results on the second. (Though not always. That’s you we’re talking about, Tampa Bay.)
I’ve devised a quick little index to assess this year’s business results. Each franchise’s winning percentage (W%) and average home attendance per game (A/G) have been compared to the big-league norms as of August 1.
Each component is measured against a 50-point standard. A club that matched the major-league averages of .500 for W% and 29,101 for A/G would earn dual scores of 50, adding to precisely 100 points.
A higher score indicates that a given club is more successful than the average team, and no one is doing better in that sense than the Los Angeles Dodgers. Their index of 140.7 is based on a winning percentage of .578 and an average of 48,227 fans per home game. Impressive figures all the way around.
Below are the top 10 clubs in 2024’s business ratings. You’ll see a few laggards on the field who are prospering at the box office (the Cardinals, Astros, and Cubs), and you’ll also notice that two strong performers on the diamond are missing here. The Baltimore Orioles (11th in the business index) and the Cleveland Guardians (13th) are certainly winning games, but they aren’t selling as many tickets as they should.
Each team is listed with its two relevant stats as of August 1, followed by its business score:
-
1. Los Angeles Dodgers (W% .578, A/G 48,227), 140.7 points
-
2. Philadelphia Phillies (W% .602, A/G 41,440), 131.4 points
-
3. New York Yankees (W% .591, A/G 41,910), 131.1 points
-
4. San Diego Padres (W% .536, A/G 40,462), 123.1 points
-
5. Atlanta Braves (W% .542, A/G 38,190), 119.8 points
-
6. St. Louis Cardinals (W% .519, A/G 36,549), 114.7 points
-
7. Houston Astros (W% .519, A/G 34,716), 111.5 points
-
8. Chicago Cubs (W% .473, A/G 36,525), 110.1 points
-
9. Boston Red Sox (W% .533, A/G 32,885), 109.8 points
-
10. Milwaukee Brewers (W% .565, A/G 30,683), 109.2 points
2. WORST: Business failures
This has been a year of abject failure for the Chicago White Sox, whose winning percentage at the four-month mark was an atrocious .243. The Sox haven’t been doing well at the box office, either. Their average of 16,438 fans per home game is the third-worst in the majors.
The outcome, as you would expect, is that the White Sox are saddled with baseball’s worst business index, just 52.5 points. That’s 47.5 percent below the big-league average of 100.
Below are the 10 teams with the worst business scores for 2024. The biggest surprise is the inclusion of the Kansas City Royals, whose improvement on the field hasn’t been matched at the box office.
-
1. Chicago White Sox (W% .243, A/G 16,438), 52.5 points
-
2. Oakland Athletics (W% .409, A/G 8,025), 54.7 points
-
3. Miami Marlins (W% .370, A/G 13,216), 59.7 points
-
4. Tampa Bay Rays (W% .509, A/G 16,849), 79.8 points
-
5. Detroit Tigers (W% .477, A/G 21,438), 84.5 points
-
6. Washington Nationals (W% .450, A/G 25,377), 88.6 points
-
7. Colorado Rockies (W% .358, A/G 30,812), 88.7 points
-
8. Kansas City Royals (W% .550, A/G 19,878), 89.2 points
-
9. Pittsburgh Pirates (W% .509, A/G 22,501), 89.6 points
-
10. Cincinnati Reds (W% .481, A/G 25,109), 91.2 points
3. GRAPH: Catching thieves
It has gotten tougher and tougher for pitchers and catchers to control baserunners.
Part of the problem, of course, is that the rules were tweaked a year ago to encourage thievery. Larger bases and fewer pitcher “disengagements” have spurred an increase in stolen bases.
Less noted is the generally upward trend in steals over recent decades. Players in 1954 accounted for only 0.28 stolen bases per game, a figure that had risen almost twice as high (0.51) by 2022, the year prior to the rule adjustment.
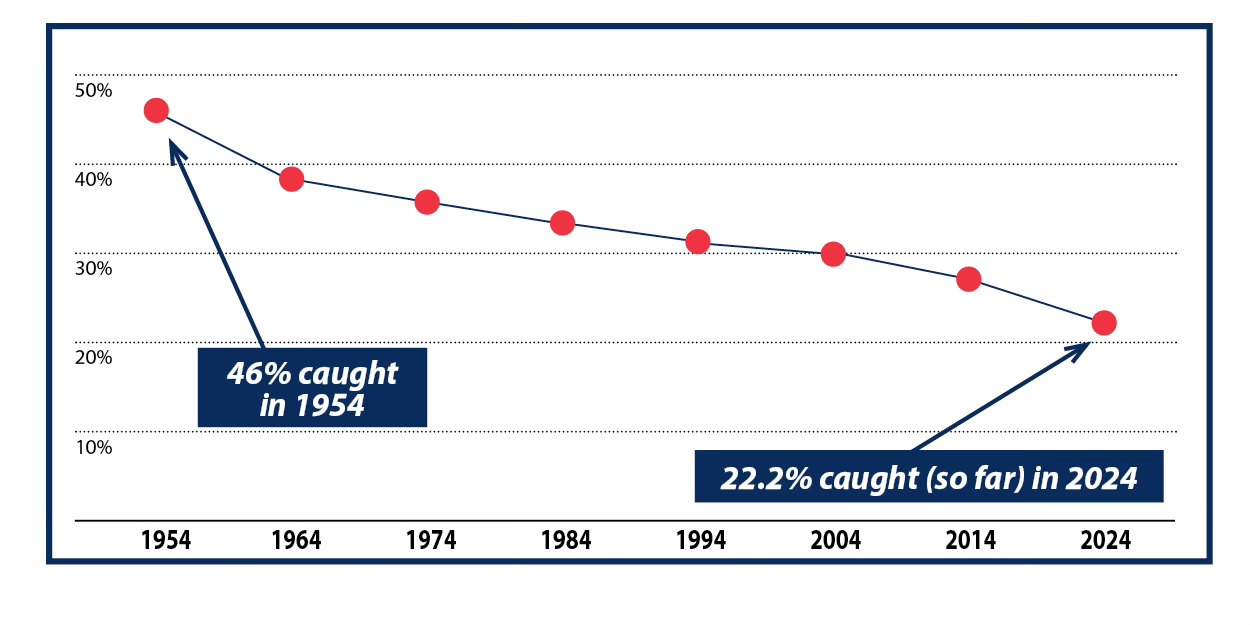
There has been a corresponding decline in the percentage of prospective stealers who get caught. Nearly half of them — 46 percent — were gunned down in 1954. That figure dropped to an all-time low of 19.8 percent in 2023. It’s up slightly to 22.2 percent so far this year, which still means that more than three-quarters of all steal attempts are successful.
Today’s graph shows the percentage of prospective thieves who were caught stealing (at 10-year intervals). The trend is unmistakable.
Subscribe — free — to Baseball’s Best (and Worst)
A new installment will arrive in your email each Tuesday morning
4. QUIZ: Four-month leaders
Four months down, two to go.
We’re almost a week into August, a bit too early for the stretch drive, but late enough to pay serious attention to the leaders in various statistical categories.
Today’s quiz is about the major-league pacesetters as of August 1. The stats cited below aren’t the obvious ones — homers, RBIs, earned run average — though they’re certainly significant in their own right.
Can you name the frontrunners? The answers, as always, can be found at the bottom of this newsletter.
1. Which player has scored the most runs?
-
A. Gunnar Henderson
-
B. Aaron Judge
-
C. Juan Soto
-
D. Bobby Witt Jr.
2. Who has hit the most doubles?
-
A. Alec Bohm
-
B. Jarren Duran
-
C. Ezequiel Tovar
-
D. Bobby Witt Jr.
3. And what about triples?
-
A. Corbin Carroll
-
B. Elly De La Cruz
-
C. Jarren Duran
-
D. Mike Yastrzemski
4. Which starting pitcher has the lowest WHIP (walks and hits allowed per inning pitched)?
-
A. Logan Gilbert
-
B. Tyler Glasnow
-
C. Chris Sale
-
D. Tarik Skubal
5. Games finished (GF) is a rarely cited stat that’s not the same as saves. It simply counts the number of times a relief pitcher wrapped up a game for his team, win or lose. Who is first in this category?
-
A. Emmanuel Clase
-
B. Kyle Finnegan
-
C. Josh Hader
-
D. Ryan Helsley
5. LEADERBOARD: Biggest losers
It takes substantial ability to become a big-time loser in the major leagues.
Say what?
My point really should be an obvious one. A pitcher has to remain in the rotation to pile up a large number of losses. No manager is going to keep giving the ball to somebody who lacks talent.
That’s why the following list — a rundown of pitchers who’ve suffered the most defeats during the Modern Era (1961 to present) — is dominated by Hall of Famers. Eight of the top 10 have been enshrined in Cooperstown, led by Nolan Ryan, who won 324 games in his 27-year career, but also lost 292.
The only pitchers on the list who aren’t in the hall? Frank Tanana and Tommy John. The following stats come that indispensable source, Baseball Reference:
-
1. Nolan Ryan (1966-1993), 292 losses
-
2. Phil Niekro (1964-1987), 274 losses
-
3. Gaylord Perry (1962-1983), 265 losses
-
4. Don Sutton (1966-1988), 256 losses
-
5. Bert Blyleven (1970-1992), 250 losses
-
6. Steve Carlton (1965-1988), 244 losses
-
7. Frank Tanana (1973-1993), 236 losses
-
8. Tommy John (1963-1989), 231 losses
-
9. Jim Kaat (1961-1983), 230 losses
-
10. Greg Maddux (1986-2008), 227 losses
6. TRACKING THE BEST: ’84 Tigers
The 1984 Detroit Tigers — the greatest team of baseball’s Modern Era — began the week of July 30 to August 5 with a 12-game lead in the American League East.
It appeared to be time for the Tigers to switch to cruise control, starting to conserve their energy for the postseason.
That’s precisely what they did, though a bit too abruptly for their fans. Detroit began the week by splitting a four-game series with the Cleveland Indians, then dropped an entire four-game set to the Kansas City Royals.
The Tigers’ cumulative record for the week was a miserable 2-6. They scored a total of 28 runs and surrendered 39. Their division lead over the Toronto Blue Jays declined to eight games by the morning of August 6.
So much for cruise control.
7. TRACKING THE WORST: ’62 Mets
The New York Mets would lose 120 games in 1962, a mark of ineptitude that remains the single-season record for defeats, though the 2024 Chicago White Sox are threatening to roar past 120 and keep going.
The Mets actually enjoyed a fairly successful week 62 years ago. They went 3-4 between July 30 and August 5. It was especially impressive that their three victories were consecutive, constituting New York’s longest winning streak of the 1962 season.
The Mets defeated the Cincinnati Reds by scores of 9-1, 3-2, and 5-2. Hard-luck pitchers Roger Craig and Al Jackson — the mainstays of the club’s rotation — each notched a victory during the streak. Yet their overall records remained awful: 6-17 for Craig, 6-13 for Jackson.
And the club’s record was even worse. The Mets stood at 29-80 at daybreak on August 6, mired deep in last place in the National League.
8. QUIZ ANSWERS: Four-month leaders
1-D. (Witt crossed the plate 91 times for the Royals through the end of July. He was two runs ahead of the runner-up, Soto of the Yankees.)
2-A. (Bohm held a respectable lead in this category after four months. The third baseman for the Phillies had a total of 38 doubles. Second place went to Duran of the Red Sox at 33.)
3-C. (Duran sat on top with 12 triples as of the morning of August 1. Bobby Witt Jr., who wasn’t listed as an option, was second with 10.)
4-A. (Gilbert’s WHIP of 0.896 for the Mariners was the best in the majors after four months. The runner-up was Skubal of the Tigers at 0.923.)
5-A. (Clase set the pace with 46 games finished in the first four months. The other three listed pitchers were tied for second with 42 apiece.)
