

You’re probably familiar with the saying, “Happiness equals reality minus expectations.” Maybe because your Aunt Debbie shared a post from her favorite social media influencer. Maybe because you passed the time during a layover at the airport perusing the self-help books in the Hudson News near your gate. Like most self-help tropes, whether or not it hits for you depends a little on your life circumstances and a little on how you choose to apply it. When it comes to sports fandom, emotional hedging can be a useful tool to avoid disappointment, or maybe you prefer projecting confidence to manifest a desired outcome. And if you’re a Phillies fan, you’ve perfected the art of oscillating wildly between the two over the course of a single game. You even have a handy meme with a meter that only ever points to one extreme or the other:
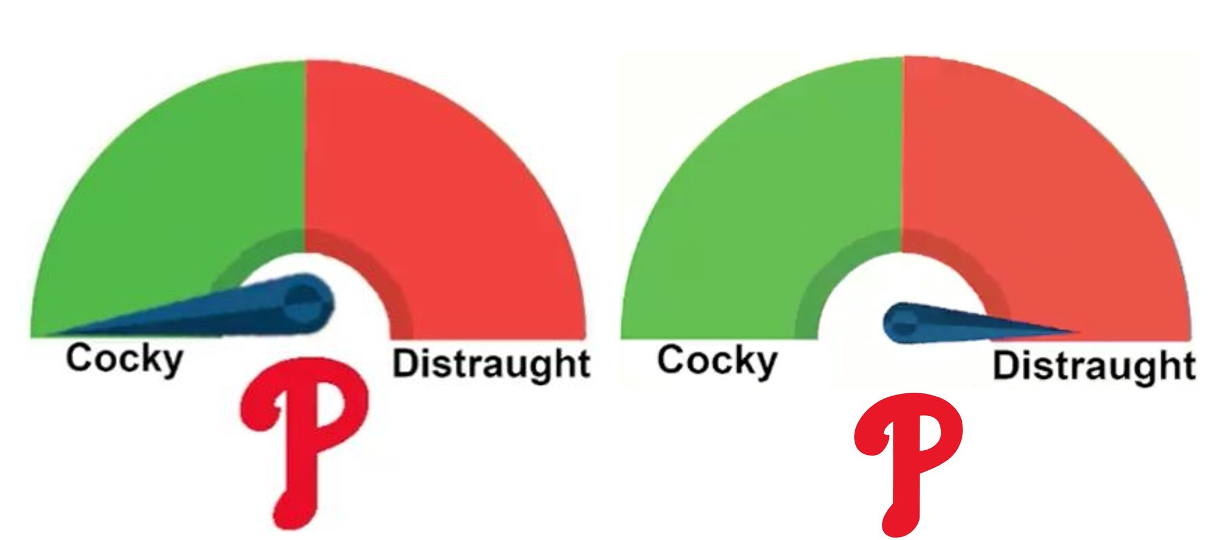
(Please excuse the mismatched needle sizes and logo alignment. These images are precious internet relics that have been downloaded, clumsily edited, re-uploaded, compressed, and decompressed hundreds, if not thousands, of times. The pixelation is earned like callouses on the hands of a skilled laborer.)
But the formula seems to assume that expectations are set and controlled by the person in search of a happy existence. The entire notion is upended when mathematical models based on historical outcomes become the source for baseline expectations. In this scenario, if your team is outperforming expectations, then you can enjoy the banked wins, but you do so in fear of the rainier days that surely lie somewhere in the team’s future forecast. Whereas if your team is underperforming expectations, things might feel dire, but there’s reason to believe sunnier days lie ahead.
Of course, in the current era of baseball analysis, we have numerous systems for modeling wins and losses that all set expectations in their own way. Projection systems calibrate our expectations for the future, while a team’s Pythagorean winning percentage or BaseRuns record retroactively re-calibrates actual outcomes to align with expected ones. In terms of the happiness equation, resetting expectations after the fact is a really great way to make sure everyone walks away with hurt feelings. Unless your team’s reality perfectly aligns with what the numbers say should have happened, then whatever you’re feeling about your team’s record is instantly invalidated. If you’re happy because your team is winning, then the numbers suggest your enjoyment is in vain because a fall from grace is imminent. If you’re sad because your team is losing, the numbers suggest you have no reason to be depressed even though everything happening on the field thus far has been super depressing.
Anyway, I hope you’ve all come here to have your feelings hurt because it’s time to consider the teams with the largest disparities between their actual record and their BaseRuns record.
Why BaseRuns and not Pythagorean W-L? The Pythagorean method makes its estimate using just a team’s runs scored and runs allowed. And though that estimate does tend to provide a more accurate representation of a team’s true talent, it’s still influenced by the random variation that applies to the sequencing of events during a game. More so than in most other sports, baseball is a series of events (plate appearances) whose outcomes are largely independent of one another. They’re not completely independent of one another, as a runner reaching base might impact how a pitcher approaches the next batter, and a hitter’s first plate appearance against a starter might alter strategy during the second. But overall, things are far less interconnected than in continuous action sports like basketball or hockey. Since plate appearance outcomes are not elements of a chain reaction, the whims of random variation dictate whether a cluster of hits occur in the same inning and lead to multiple runs, or instead, whether the same number of hits are scattered across several frames and lead to zero runs. A team regularly benefitting from atypical sequencing might appear especially proficient at run scoring or run prevention in a way that isn’t entirely owed to their ability. Pythagorean W-L has no way of detecting this.
That’s where the BaseRuns method of record estimation comes in. BaseRuns estimates the number of runs a team should have scored or allowed based on their actual plate appearance outcomes and assuming typical sequencing. It doesn’t completely ignore sequencing, because a team’s offense procreates like bunnies (or increases exponentially, if you prefer) as it gets consistent contributions from additional members of the lineup. But the BaseRuns estimation algorithm does dampen the effect of extremely unlikely sequences, the ones not tied to a team’s actual production, such as an offense that averages five hits per game and regularly gets all five hits in the same inning.
Now with this understanding, we can go to the BaseRuns tab of the FanGraphs standings page and determine which teams were most helped or hurt by unlikely sequencing, and have our emotions swayed as we question our perception of which teams are good (or bad) and which teams are maybe not as good (or bad) as we originally thought. As of this writing, the Rockies’ BaseRuns record is quite bad at 25-54, but not as bad as their actual record, which sits at 18-61. It figures that a team on pace for a historically bad season is catching some bad breaks on the sequencing front. And while that reading of BaseRuns is interesting on its own, the one-size-fits-all sequencing explanation belies the nuanced, team-specific experiences that feed into these divergent records.
Some teams miss the expected mark exclusively on one side of the ball. On the hitting side, the Royals, Mets, and A’s come in under their estimated runs scored per game, while the Tigers and Brewers have scored more runs per game than expected. On the pitching side, the White Sox and Guardians are allowing fewer runs per game than BaseRuns expects, while the Red Sox and Twins are on the wrong side of their runs allowed estimation. Other teams’ outcomes are worse than expected on both sides of the ball. Predictably, those teams are the Pirates and Rockies. Meanwhile, the Rays and Brewers (and to a lesser degree the Dodgers and Cubs) are managing to exceed expectations on both sides of the ball. And then there are the Cardinals and Braves, who balance out their over-performance on one side of the ball by underperforming on the other side. Atlanta both allows and scores fewer runs than expected, while St. Louis both allows and scores more runs than expected.
Since a wide gap between actual and expected runs on one side of the ball may indicate something specific about a team’s personnel or strategy that isn’t captured by the BaseRuns estimation algorithm, I’ll save a deeper, team-level exploration of how and why several offenses and defenses have gone so far astray of expectations for a separate piece tomorrow.
Today, though, I’d like to draw your attention to one final category of team for whom the BaseRuns record begs to differ. For the Yankees and Blue Jays, the BaseRuns estimates for runs scored and runs allowed per game largely agree with reality. And yet, BaseRuns believes that the Yankees should have six additional wins and the Blue Jays should have three fewer wins. This is where run differential comes back into the mix. Once BaseRuns has estimated a team’s runs, the difference between runs scored and allowed is used to estimate a winning percentage. For these teams, BaseRuns doesn’t contend that the run scoring in their games is unusual; it’s the way those runs are distributed to create wins and losses that is odd.
The Yankees run differential heading into games on Wednesday is +104, which Pythagorean W-L says should amount to five more wins; add in BaseRuns’ belief that they should have scored a few more runs and allowed a few less, and that accounts for the additional win. The Blue Jays -6 run differential has Pythagorean W-L subtracting four wins from their total, but BaseRuns gives one win back because it figures they should have allowed around six runs fewer.
Though the point of BaseRuns and Pythagorean W-L is to strip out context like sequencing and the distribution of scoring, is it possible they overcorrect by removing all context? In the context of blowouts, it’s clear teams do behave differently. They stop attempting to approximate their true talent as a team. Bench players sub in for starters, no one’s running out groundballs, and position players are pitching. It’s no longer a representative sample of who the team really is. Things probably even out over the course of a full season, but when the season is just under the halfway mark, a few blowouts have the potential to really skew the numbers. So I decided to prune the sample. I didn’t drop blowouts from the calculation entirely; the Reds still deserve some credit for thumping the Orioles 24-2 on Easter Sunday, and the O’s should bear some consequences for showing up to that game with the same energy as a hungover uncle at an egg hunt. So I compromised, and stopped counting stats if at any point in the fifth inning or later the score, by rule, would have allowed a position player to enter the game as a pitcher. Neither team actually needed to bring in a position-player pitcher; the option just needed to be on the table. Because once that option exists, the effort levels in a game quickly reach that of a teenager forced to participate in an egg hunt.
I used this approach to first re-calculate each team’s run differential and Pythagorean W-L based on that run differential:
Adjusted Pythagorean W-L
| 2025 YTD | Actual Pythagorean W-L | Adjusted Pythagorean W-L | |||||||||||
|---|---|---|---|---|---|---|---|---|---|---|---|---|---|
| Team | G | W | L | W% | Rdif | W | L | W% | Rdif | W | L | W% | +/- |
| Athletics | 81 | 32 | 49 | .395 | -134 | 28 | 53 | .344 | -97 | 31 | 50 | .379 | 3 |
| Nationals | 80 | 33 | 47 | .413 | -70 | 33 | 47 | .412 | -45 | 35 | 45 | .439 | 2 |
| Twins | 79 | 37 | 42 | .468 | -20 | 37 | 42 | .473 | -2 | 39 | 40 | .497 | 2 |
| Orioles | 79 | 34 | 45 | .430 | -80 | 31 | 48 | .395 | -64 | 32 | 47 | .410 | 1 |
| Marlins | 77 | 32 | 45 | .416 | -88 | 30 | 47 | .384 | -72 | 31 | 46 | .399 | 1 |
| Angels | 79 | 39 | 40 | .494 | -49 | 34 | 45 | .436 | -39 | 35 | 44 | .448 | 1 |
| Guardians | 77 | 39 | 38 | .506 | -27 | 35 | 42 | .460 | -20 | 36 | 41 | .469 | 1 |
| White Sox | 80 | 25 | 55 | .313 | -86 | 30 | 50 | .379 | -74 | 31 | 49 | .387 | 1 |
| Padres | 79 | 43 | 36 | .544 | 22 | 42 | 37 | .531 | 26 | 43 | 36 | .539 | 1 |
| Mets | 80 | 46 | 34 | .575 | 57 | 46 | 34 | .580 | 58 | 47 | 33 | .587 | 1 |
| Blue Jays | 78 | 42 | 36 | .538 | -6 | 38 | 40 | .492 | -1 | 39 | 39 | .499 | 1 |
| Phillies | 79 | 47 | 32 | .595 | 40 | 44 | 35 | .553 | 42 | 44 | 35 | .559 | 0 |
| Cardinals | 80 | 44 | 36 | .550 | 41 | 44 | 36 | .553 | 44 | 45 | 35 | .559 | 0 |
| Giants | 79 | 44 | 35 | .557 | 44 | 45 | 34 | .564 | 44 | 45 | 34 | .567 | 0 |
| Astros | 79 | 46 | 33 | .582 | 47 | 45 | 34 | .568 | 44 | 45 | 34 | .570 | 0 |
| Rockies | 79 | 18 | 61 | .228 | -204 | 21 | 58 | .260 | -191 | 21 | 58 | .261 | 0 |
| Braves | 78 | 37 | 41 | .474 | 29 | 42 | 36 | .542 | 28 | 42 | 36 | .542 | 0 |
| Tigers | 80 | 50 | 30 | .625 | 89 | 49 | 31 | .615 | 82 | 49 | 31 | .613 | 0 |
| Dodgers | 80 | 49 | 31 | .613 | 80 | 48 | 32 | .594 | 75 | 47 | 33 | .590 | 0 |
| Royals | 79 | 38 | 41 | .481 | -25 | 36 | 43 | .460 | -28 | 36 | 43 | .452 | -1 |
| Dbacks | 79 | 41 | 38 | .519 | 10 | 40 | 39 | .512 | 0 | 40 | 40 | .500 | -1 |
| Yankees | 79 | 45 | 34 | .570 | 104 | 50 | 29 | .637 | 86 | 49 | 30 | .623 | -1 |
| Pirates | 81 | 32 | 49 | .395 | -66 | 33 | 48 | .403 | -71 | 31 | 50 | .389 | -1 |
| Brewers | 80 | 44 | 36 | .550 | 46 | 45 | 35 | .561 | 31 | 44 | 36 | .546 | -1 |
| Mariners | 78 | 41 | 37 | .526 | 22 | 41 | 37 | .529 | 9 | 40 | 38 | .512 | -1 |
| Red Sox | 81 | 40 | 41 | .494 | 10 | 42 | 39 | .513 | -3 | 40 | 41 | .496 | -1 |
| Rangers | 80 | 39 | 41 | .488 | 11 | 41 | 39 | .517 | -1 | 40 | 40 | .498 | -2 |
| Rays | 79 | 44 | 35 | .557 | 74 | 47 | 32 | .600 | 56 | 46 | 33 | .579 | -2 |
| Reds | 80 | 42 | 38 | .525 | 40 | 44 | 36 | .553 | 22 | 42 | 38 | .530 | -2 |
| Cubs | 79 | 46 | 33 | .582 | 89 | 48 | 31 | .610 | 61 | 46 | 33 | .577 | -3 |
Data through start of games on 6/25
For the most part, the adjusted version of Pythagorean W-L is a more muted version of the original. The estimates mostly maintain the same directionality, but to less of an extreme. Most prominently, it goes from dinging the Athletics for four wins to subtracting just one, and though it still estimates a slightly higher winning percentage for the Reds, after rounding, it takes back the two additional wins they gain in the standard calculation. For the A’s, the change stems from ignoring the tail end of an 18-3 loss to the Cubs, a 14-1 defeat in Milwaukee, a 15-2 drubbing from the Rangers, and a 19-2 rout from the Dodgers, which brings their -134 run differential to a somewhat less embarrassing -97. Meanwhile, the Reds’ run differential of 38 loses some of the padding gained by rolling over the Rangers 14-3, knocking the Orioles around in the aforementioned 24-2 victory, and besting the Diamondbacks 13-1, leaving the club’s adjusted run differential at 22.
But there are a few teams where the adjusted version does metaphorically change its mind. The Cubs’ new winning percentage comes in just under their actual win rate, whereas before they got a two-win bump. Then it goes from an estimate just under the Nationals’ actual winning percentage to adding two wins to the team’s appraisal. The Cubs’ actual run differential of 89 drops to 61 after re-evaluating an 18-3 win over the A’s, a 16-0 win against the Dodgers, and a 14-1 victory in Miami, among others. For their part, the Nationals actually provide a compelling argument against this method. Though their run differential improves by 25 runs, going from -70 to -45, around two-thirds of that improvement comes in games that the Nationals won, where they jumped out to a sizable lead through five innings, then let their opponent get back within striking distance. Most notably, on April 19, Washington led Colorado 12-2 at the seventh-inning stretch in Denver, but allowed eight runs in the bottom of the frame and an additional run in the ninth for a final score of 12-11. One might argue that it’s fair for a team to take it easy when they’re up by a ton, but a repeated pattern of letting opponents resurrect their chances feels like it does represent a team’s quality in its own way. That said, it’s probably safe to assume the 2025 Nationals are an outlier and that a tweak to the algorithm that starts counting stats again when the losing team pulls within three isn’t necessary.
Next, here’s the output after curtailing blowouts in the BaseRuns algorithm:
Adjusted BaseRuns Records
| 2025 YTD | Actual BaseRuns | Adjusted BaseRuns | ||||||||||||
|---|---|---|---|---|---|---|---|---|---|---|---|---|---|---|
| Team | G | W% | RDif | RS/G | RA/G | W% | RDif | RS/G | RA/G | W% | RDif | RS/G | RA/G | +/- |
| Athletics | 81 | .395 | -134 | 4.19 | 5.84 | .378 | -105 | 4.43 | 5.73 | .400 | -87 | 4.31 | 5.38 | 2 |
| Nationals | 80 | .413 | -70 | 4.28 | 5.15 | .418 | -64 | 4.20 | 5.00 | .435 | -48 | 3.91 | 4.52 | 1 |
| Twins | 79 | .468 | -20 | 4.24 | 4.49 | .504 | 3 | 4.22 | 4.18 | .521 | 15 | 4.17 | 3.99 | 1 |
| Orioles | 79 | .430 | -80 | 3.99 | 5.00 | .383 | -91 | 4.03 | 5.18 | .398 | -78 | 3.89 | 4.88 | 1 |
| Angels | 79 | .494 | -49 | 4.22 | 4.84 | .409 | -69 | 4.02 | 4.89 | .416 | -64 | 3.98 | 4.79 | 1 |
| Phillies | 79 | .595 | 40 | 4.67 | 4.16 | .542 | 32 | 4.75 | 4.34 | .549 | 36 | 4.53 | 4.07 | 1 |
| White Sox | 80 | .313 | -86 | 3.41 | 4.49 | .351 | -109 | 3.41 | 4.77 | .357 | -106 | 3.50 | 4.83 | 0 |
| Astros | 79 | .582 | 47 | 4.23 | 3.63 | .550 | 35 | 4.25 | 3.80 | .556 | 37 | 4.07 | 3.60 | 0 |
| Braves | 78 | .474 | 29 | 4.22 | 3.85 | .532 | 23 | 4.35 | 4.06 | .537 | 26 | 4.21 | 3.88 | 0 |
| Tigers | 80 | .625 | 89 | 5.03 | 3.91 | .590 | 67 | 4.65 | 3.82 | .594 | 68 | 4.54 | 3.69 | 0 |
| Rockies | 79 | .228 | -204 | 3.58 | 6.16 | .312 | -156 | 3.88 | 5.85 | .316 | -147 | 3.54 | 5.40 | 0 |
| Marlins | 77 | .416 | -88 | 4.03 | 5.17 | .409 | -69 | 4.23 | 5.13 | .411 | -63 | 3.76 | 4.58 | 0 |
| Mets | 80 | .575 | 57 | 4.41 | 3.70 | .605 | 78 | 4.72 | 3.75 | .606 | 77 | 4.61 | 3.64 | 0 |
| Guardians | 77 | .506 | -27 | 3.79 | 4.14 | .431 | -48 | 3.79 | 4.41 | .432 | -47 | 3.75 | 4.36 | 0 |
| Padres | 79 | .544 | 22 | 4.24 | 3.96 | .526 | 18 | 4.15 | 3.92 | .526 | 17 | 3.95 | 3.74 | 0 |
| Royals | 79 | .481 | -25 | 3.33 | 3.65 | .500 | 0 | 3.70 | 3.71 | .498 | -1 | 3.68 | 3.70 | 0 |
| Blue Jays | 78 | .538 | -6 | 4.36 | 4.44 | .501 | 0 | 4.37 | 4.36 | .499 | -1 | 4.30 | 4.31 | 0 |
| Giants | 79 | .557 | 44 | 4.23 | 3.67 | .541 | 28 | 4.04 | 3.69 | .538 | 25 | 3.95 | 3.63 | 0 |
| Mariners | 78 | .526 | 22 | 4.67 | 4.38 | .527 | 21 | 4.72 | 4.45 | .524 | 19 | 4.68 | 4.44 | 0 |
| Cardinals | 80 | .550 | 41 | 4.78 | 4.26 | .544 | 33 | 4.54 | 4.13 | .541 | 31 | 4.49 | 4.10 | 0 |
| Yankees | 79 | .570 | 104 | 5.06 | 3.75 | .652 | 115 | 5.10 | 3.64 | .649 | 108 | 4.78 | 3.42 | 0 |
| Dbacks | 79 | .519 | 10 | 5.19 | 5.06 | .527 | 22 | 5.23 | 4.94 | .523 | 20 | 4.97 | 4.73 | 0 |
| Rays | 79 | .557 | 74 | 4.76 | 3.82 | .556 | 41 | 4.51 | 3.99 | .552 | 38 | 4.55 | 4.06 | 0 |
| Dodgers | 80 | .613 | 80 | 5.64 | 4.64 | .562 | 52 | 5.44 | 4.79 | .555 | 46 | 5.06 | 4.48 | -1 |
| Brewers | 80 | .550 | 46 | 4.69 | 4.11 | .514 | 10 | 4.38 | 4.26 | .503 | 2 | 3.96 | 3.93 | -1 |
| Rangers | 80 | .488 | 11 | 3.60 | 3.46 | .536 | 23 | 3.66 | 3.37 | .525 | 15 | 3.62 | 3.43 | -1 |
| Reds | 80 | .525 | 40 | 4.64 | 4.14 | .529 | 22 | 4.52 | 4.24 | .516 | 12 | 4.35 | 4.20 | -1 |
| Pirates | 81 | .395 | -66 | 3.27 | 4.09 | .460 | -27 | 3.55 | 3.89 | .443 | -37 | 3.47 | 3.93 | -1 |
| Red Sox | 81 | .494 | 10 | 4.68 | 4.56 | .561 | 47 | 4.69 | 4.11 | .544 | 33 | 4.49 | 4.08 | -1 |
| Cubs | 79 | .582 | 89 | 5.39 | 4.27 | .585 | 68 | 5.25 | 4.40 | .558 | 46 | 4.93 | 4.34 | -2 |
Data through start of games on 6/25
Adjusting the BaseRuns estimates leads to less extreme changes than the adjustments to Pythagorean W-L, but the pattern of changes varies more. The estimates for some teams retreat closer to the team’s actual record, as is the case with the Orioles, Angels, Phillies, Red Sox, Pirates, and Rangers. For other teams, the estimates further solidify the original BaseRuns evaluation by taking it even further, as with the Nationals (a team BaseRuns already liked more than Pythagorean W-L), Twins, Brewers, and Dodgers.
And like Pythagorean W-L, BaseRuns does change its position on a couple of clubs. Unlike Pythagorean W-L, which came away less cynical about the A’s but still below their actual record, the adjusted version of BaseRuns has the Athletics at .400, above both its original estimate of .378 and the team’s actual mark of .395. But BaseRuns does agree with Pythagorean W-L about the Cubs, going from giving their winning percentage a slight boost to .585 to clawing back two wins, leaving them at .558. The adjusted version goes the other way with the Reds as well, moving its .529 estimated winning percentage back to .516, below Cincinnati’s current mark of .525.
The theory behind removing context from BaseRuns and Pythagorean W-L is that teams don’t control contextual factors, and thus context doesn’t matter when it comes to approximating a winning percentage that is a truer representation of team quality. But blowouts demonstrate that sometimes context does matter, because that context can influence a team’s strategy and effort level. Or rather, it influences how they feel about the game and how they act in response to those feelings. And it’s the context around a game or team or player that shapes how we as spectators feel. A go-ahead home run feels better than one where the hitter’s team trails by seven. Nick Castellanos catching the final out of a two-run game against the Marlins feels better when you know that he’s from Miami and was benched the day before for grousing at his manager during the first game of the series after he was removed in the eighth inning for a defensive replacement.
They say facts don’t care about your feelings and BaseRuns doesn’t care about context. But sometimes context does matter and how we feel about it matters too. As any Philly fan will tell you, you are allowed to feel distraught because Aaron Nola gave up a solo homer in the fifth inning, even though the team is still up by four. And you are allowed to be cocky about your team even if BaseRuns thinks the number in the win column is higher than it should be.


